What is the next step after automating traffic generation on the Spirent? It’s worth knowing its parameters such as bit rate or total frame count. We can access this data through the analyzers, and that’s what we gonna do in this article.
Environment
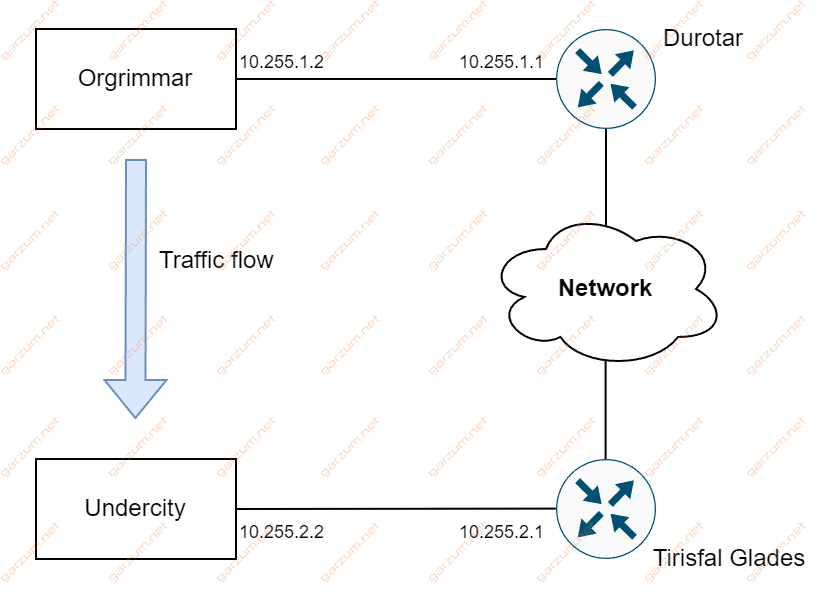
Today we will use the same topology as in the previous article. On the Spirent, we will configure two emulated devices – Orgrimmar and Undercity, with the traffic flowing from the first one to the second.
We will also use the majority of the code written in the previous article. If you need more information, head to the Automate basic Spirent traffic flow with REST API in Python article.
The role of analyzers
Analyzer objects give us access to the statistics. Every port has its analyzer. In this example, we will grab the analyzer from the Spirent port 2, under which the Undercity emulated device is configured.
analyzer = stc_session.get(port2_handler, "children-Analyzer")By doing this, we will be able to see what’s going on at port 2 at different points in time.
Similarly to generators, we have to start analyzers as well.
stc_session.perform("AnalyzerStart", AnalyzerList=analyzer)Getting statistics
The next step is to get a direct statistics handler from the analyzer.
results_handler = stc_session.get(analyzer, "children-AnalyzerPortResults")Now, we can get current statistics by calling the get function on the Spirent Test Center session and passing results_handler as an argument.
stats = stc_session.get(results_handler)The complete port statistics are now available through the stats variable.
Keep in mind, that such a function call will return current statistics. It means, that if you start sending traffic, and grab statistics a couple of times, they will be different each time. We will observe such behavior during the script run.
The structure of statistics
How can we grab what’s interesting for us, and basically what is available?
Let’s first examine the stats variable type.
type(stats)
<class 'dict'>
It’s a dictionary, so let’s check it’s content.
{
 'Active': 'true',
 'ComboTriggerCount': '0',
 'ComboTriggerRate': '0',
 'CorrectedBaseRFecErrorCount': '0',
 'CorrectedRsFecErrorCount': '0',
 'CorrectedRsFecSymbols': '0',
 'CounterTimestamp': '0',
 'DroppedFrameCount': '0',
 'DuplicateFrameCount': '0',
 'FcoeFrameCount': '0',
 'FcoeFrameRate': '0',
 'FcsErrorFrameCount': '0',
 'FcsErrorFrameRate': '0',
 'FirstArrivalTime': '476718063883.84',
 'HwFrameCount': '0',
 'IcmpFrameCount': '0',
 'IcmpFrameRate': '0',
 'InOrderFrameCount': '6151548',
 'Ipv4ChecksumErrorCount': '0',
 'Ipv4ChecksumErrorRate': '0',
 'Ipv4FrameCount': '6151548',
 'Ipv4FrameRate': '84458',
 'Ipv6FrameCount': '0',
 'Ipv6FrameRate': '0',
 'Ipv6OverIpv4FrameCount': '0',
 'Ipv6OverIpv4FrameRate': '0',
 'JumboFrameCount': '0',
 'JumboFrameRate': '0',
 'L1BitCount': '7283479104',
 'L1BitRate': '99998754',
 'L1BitRatePercent': '9.9998754',
 'LastArrivalTime': '476796530161.89',
 'LateFrameCount': '0',
 'MaxFrameLength': '505',
 'MinFrameLength': '64',
 'MplsFrameCount': '0',
 'MplsFrameRate': '0',
 'Name': '',
 'OutSeqFrameCount': '0',
 'OversizeFrameCount': '0',
 'OversizeFrameRate': '0',
 'PauseFrameCount': '0',
 'PauseFrameRate': '0',
 'PfcFrameCount': '0',
 'PfcFrameRate': '0',
 'PfcPri0FrameCount': '0',
 'PfcPri0FrameRate': 'null',
 'PfcPri0Quanta': '0',
 'PfcPri1FrameCount': '0',
 'PfcPri1FrameRate': 'null',
 'PfcPri1Quanta': '0',
 'PfcPri2FrameCount': '0',
 'PfcPri2FrameRate': 'null',
 'PfcPri2Quanta': '0',
 'PfcPri3FrameCount': '0',
 'PfcPri3FrameRate': 'null',
 'PfcPri3Quanta': '0',
 'PfcPri4FrameCount': '0',
 'PfcPri4FrameRate': 'null',
 'PfcPri4Quanta': '0',
 'PfcPri5FrameCount': '0',
 'PfcPri5FrameRate': 'null',
 'PfcPri5Quanta': '0',
 'PfcPri6FrameCount': '0',
 'PfcPri6FrameRate': 'null',
 'PfcPri6Quanta': '0',
 'PfcPri7FrameCount': '0',
 'PfcPri7FrameRate': 'null',
 'PfcPri7Quanta': '0',
 'PostBaseRFecSerRate': '0',
 'PostRsFecSerRate': '0',
 'PrbsBitErrorCount': '0',
 'PrbsBitErrorRate': '0',
 'PrbsBitErrorRatio': '0',
 'PrbsErrorFrameCount': '0',
 'PrbsErrorFrameRate': '0',
 'PrbsFillOctetCount': '0',
 'PrbsFillOctetRate': '0',
 'PreBaseRFecSerRate': '0',
 'PreRsFecSerRate': '0',
 'PreambleMaxLength': '8',
 'PreambleMinLength': '8',
 'PreambleTotalBytes': '49212808',
 'ReorderedFrameCount': '0',
 'SigFrameCount': '6151548',
 'SigFrameRate': '84458',
 'TcpChecksumErrorCount': '0',
 'TcpChecksumErrorRate': '0',
 'TcpFrameCount': '0',
 'TcpFrameRate': '0',
 'TotalBitCount': '6299222944',
 'TotalBitRate': '86485384',
 'TotalCellCount': '0',
 'TotalCellRate': '0',
 'TotalFrameCount': '6151601',
 'TotalFrameRate': '84459',
 'TotalOctetCount': '787402868',
 'TotalOctetRate': '10810673',
 'Trigger1Count': '0',
 'Trigger1Name': '',
 'Trigger1Rate': '0',
 'Trigger2Count': '0',
 'Trigger2Name': '',
 'Trigger2Rate': '0',
 'Trigger3Count': '0',
 'Trigger3Name': '',
 'Trigger3Rate': '0',
 'Trigger4Count': '0',
 'Trigger4Name': '',
 'Trigger4Rate': '0',
 'Trigger5Count': '0',
 'Trigger5Name': '',
 'Trigger5Rate': '0',
 'Trigger6Count': '0',
 'Trigger6Name': '',
 'Trigger6Rate': '0',
 'Trigger7Count': '0',
 'Trigger7Name': '',
 'Trigger7Rate': '0',
 'Trigger8Count': '0',
 'Trigger8Name': '',
 'Trigger8Rate': '0',
 'UdpChecksumErrorCount': '0',
 'UdpChecksumErrorRate': '0',
 'UdpFrameCount': '0',
 'UdpFrameRate': '0',
 'UncorrectedBaseRFecErrorCount': '0',
 'UncorrectedRsFecErrorCount': '0',
 'UndersizeFrameCount': '0',
 'UndersizeFrameRate': '0',
 'UserDefinedFrameCount1': '0',
 'UserDefinedFrameCount2': '0',
 'UserDefinedFrameCount3': '0',
 'UserDefinedFrameCount4': '0',
 'UserDefinedFrameCount5': '0',
 'UserDefinedFrameCount6': '0',
 'UserDefinedFrameRate1': '0',
 'UserDefinedFrameRate2': '0',
 'UserDefinedFrameRate3': '0',
 'UserDefinedFrameRate4': '0',
 'UserDefinedFrameRate5': '0',
 'UserDefinedFrameRate6': '0',
 'VlanFrameCount': '0',
 'VlanFrameRate': '0',
 'parent': 'analyzer1',
 'resultchild-Sources': 'analyzer1 resultdataset3'
}
The list of available keys is huge, and it gives us access to the many data pieces, that can be valuable for us.
Let’s assume that we’re interested in bit rate, link rate, total frame count, and total bit count. The corresponding keys for those values are
- Bit rate – L1BitRate
- Link rate – L1BitRatePercent
- Total frame count – Ipv4FrameCount
- Total bit count – TotalBitCount
Let’s write a helper function, that will print those values for us.
def print_stats(stats: dict) -> None:
    print(f"Analyzer - {stats.get('parent')}")
    print(f"    Bit rate - {stats.get('L1BitRate')}")
    print(f"    Link rate - {stats.get('L1BitRatePercent')}%")
    print(f"    Total frame count - {stats.get('Ipv4FrameCount')}")
    print(f"    Total bit count - {stats.get('TotalBitCount')}")
You can also access information about the analyzer from which the statistics come from. Its identifier is under the parent key.
Script run
The complete script run log is as follows.
Starting analyzer
Starting generator
Waiting for 120 seconds

Gathering stats from analyzer
Analyzer - analyzer1
    Bit rate - 99998787
    Link rate - 9.9998787%
    Total frame count - 10136676
    Total bit count - 10380014768
Waiting for 120 seconds

Stopping generator
Gathering stats from analyzer
Analyzer - analyzer1
    Bit rate - 94104499
    Link rate - 9.4104499%
    Total frame count - 20341327
    Total bit count - 20829637288
Waiting for 120 seconds

Gathering stats from analyzer
Analyzer - analyzer1
    Bit rate - 1860
    Link rate - 0.000186%
    Total frame count - 20341327
    Total bit count - 20829693272
Stopping analyzer
We gathered the statistics three times during the script run:
- 120 seconds after starting the traffic generator
- Right after stopping traffic generation
- 120 seconds after stopping traffic generation
Statistics gathering time is essential, as you can observe in the logs. The total counters are increasing each time statistics are gathered. The situation is different with bit and link rates. In the middle of traffic generation, they’re representing actual traffic received by the Undercity device. Right after stopping the generator, the bit and link rate are not equal to 0. It means, that the generated traffic has inertia, and it takes some time for it to completely stop.
The complete script code is available in this Spirent Automation Examples repository.
Conclusion
Adding as little as a couple of lines of code opens a wide range of possibilities for our Spirent automation. With access to the current statistics, we can not only check how much traffic is going through the environment but also monitor the number of packets passing through it. It can lead to the detection of possible problems or assure us, that everything is as expected.
This article concludes the basic Spirent automation article series. I think that with the knowledge contained in them, you’re well prepared to write your own Spirent automation scripts.
Thank you! this is all I needed!!!